Vaughan’s Elementary Schools – Making the Grade
How do Vaughan’s elementary schools stack up?
When it comes to academics, Vaughan is comfortably above average, according to the Fraser Institute’s annual School Report Cards. The study from the independent public policy think-tank looks at over 3,000 elementary schools across Ontario, rating each from 0 to 10 based on the school’s overall performance on the Education Quality and Accountability Office assessments, the province’s standardized test in reading, writing and math given to students in Grade 3 and Grade 6.
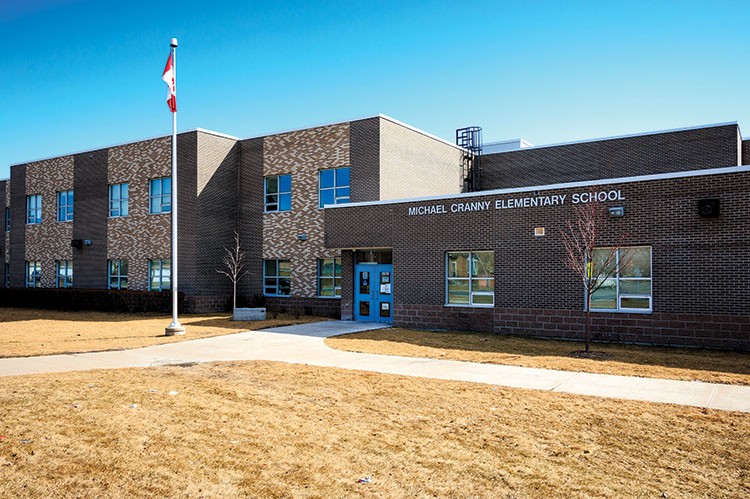
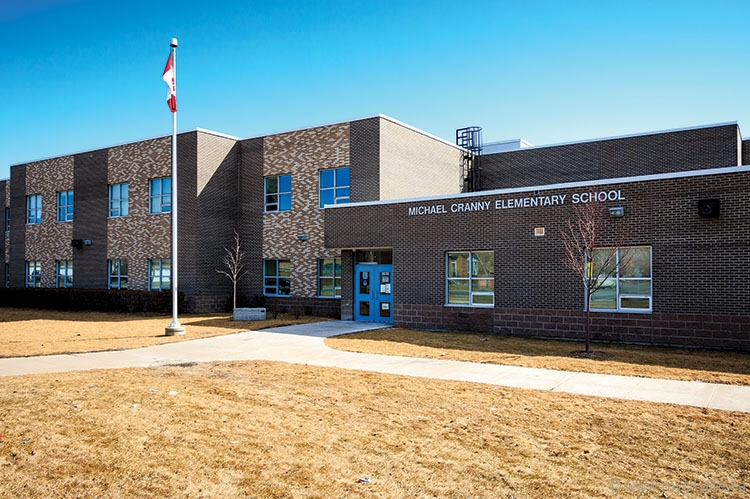
Vaughan’s highest-rated school from 2014 was Michael Cranny Elementary School, which scored an impressive 9.5 out of 10, placing it seventh out of the 234 elementary schools rated in the region and tied for 36th out of the 3,037 schools rated in the province.
The provincial average is always a 6 and each rating is relative to every other school, meaning a rating of 10 suggests that no other schools did better on the tests and, conversely, a zero indicates that no other schools did worse.
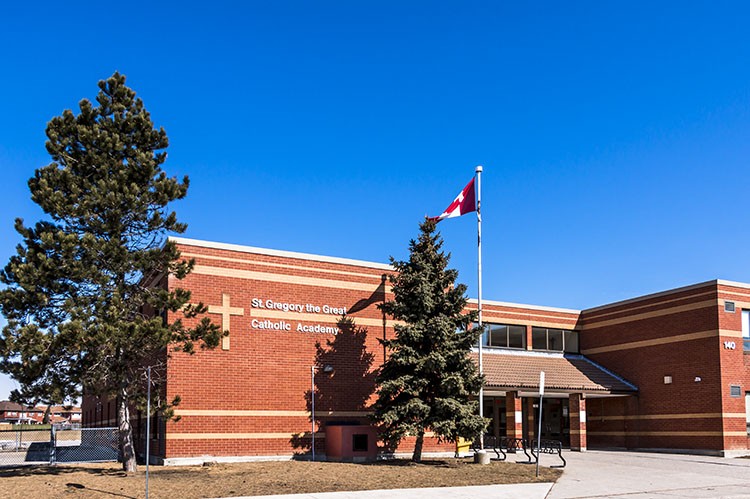
After Michael Cranny, the other top 10 rated schools in Vaughan were Discovery Public School (8.9), St. Gregory the Great Catholic Academy (8.8), St. Padre Pio Catholic Elementary School (8.6), Pierre Berton Public School (8.5), Mackenzie Glen Public School (8.5), Forest Run Public School (8.5), Herbert H. Carnegie Public School (8.4), St. Clement Catholic Elementary School (8.4), and Glen Shields Public School and Blue Willow Public School, which were tied with 8.3.
Overall, Vaughan was right on par with the rest of York Region, matching its average of 7.2 — a rating well above the provincial average.
The top six schools in York Region were all in Markham, with St. Justin Martyr Catholic Elementary School finishing first with a 10, followed by Randall Public School (9.9), Henderson Avenue Public School (9.7), William Berczy Public School (9.7), Stonebridge Public School (9.6) and Castlemore Public School (9.6).
While over 3,000 schools are rated in the study, a number are not included. Schools that only have grades from kindergarten to Grade 5 are not rated, as they lack data from the Grade 6 testing. French immersion (FI) schools are often excluded as well, as the EQAO language tests are in English, so FI school principals may opt out their students from all or some of the tests, often reading and writing. Every school must also have at least 10 student results from every test or else they are excluded.
The study, of course, is not without criticism. There are those that say such rankings foster a negative competitive atmosphere, and point out the folly of comparing schools from different socio-economic conditions, how certain schools may have a higher percentage of students with special needs or English as a second language (ESL), and that the rankings only take into consideration results from a handful of tests from two grades.
Indeed, this is only a performance-based evaluation. It doesn’t take into consideration other aspects of education, such as art and extracurricular activities, which paint a fuller, more rounded view of what schools offer. But, as Peter Cowley, director of School Performance Studies at the Fraser Institute, explains, these Report Cards give the public a look at how schools are trending academically in what the province deems the pillars of education: reading, writing and math.
“Probably the most important comparison that can be made within this report is how is a school doing compared with over the last five years,” Cowley explains.
If certain schools are trending down, we can pose the question to educators: Why are students performing worse on these standardized tests over the past five years? Schools in Vaughan that have trended downward in the last half a decade include St. Padre Pio, which despite averaging a 9.1, has slipped gradually to 8.6 from a 9.3 in 2010; St. Peter Catholic Elementary School, which has roller-coastered up and down from 9.0 in 2010 to 6.9 in 2014; and St. Agnes of Assisi Catholic Elementary School, which has slid from a respectable 7.3 in 2010 to a below-average 4.6.
If schools are improving, we can ask why, and: How can comparable schools implement a similar strategy? Michael Cranny, for example, has steadily progressed over the past five years, moving from 7.7 in 2010 to 9.5 in 2014. Others, such as Forest Run, which moved from 6.8 in 2010 to 8.5 in 2014, and Fossil Hill, which rose from 6.8 in 2010 to 8.1 in 2014, have also shown consistent, positive growth.
“Some of those schools may have implemented programs that have enabled their kids to achieve at higher levels,” Cowley explains. “And we need to analyse what they’ve done and to see if it can be adapted by other schools.”
One other example of a school that seems to be punching above its weight class is Woodbridge Public School. It has increased its rating from 6.7 in 2010 to 7.9 in 2014, despite an ESL percentage of 43.1 and a special needs percentage of 41.4. The report doesn’t indicate what sort of challenge these numbers pose for students, but considering that the average ESL percentage is 6.3 and special needs percentage is 22.7 for schools in this study, it seems that Woodbridge is doing something right.
For educators in schools that may have similar perceived challenges, examining the steps Woodbridge P.S. has taken to improve their performance in province-wide testing may bear fruit, as there’s plenty to learn from such achievements. As Cowley adds, “It doesn’t matter where you start. It matters in which direction you’re going.”
For a full listing of Fraser Institute’s ratings visit www.fraserinstitute.org
























No Comment